Article

Fructose Contents of Various Popular Sweetened Beverages based on Milk Using by HPLC

Dana Jeong1, Dong-Hyeon Kim1,, Yong-Taek Oh1, Kwang-Young Song1,*, Hong-Seok Kim1, Jung-Whan Chon1,2,, Hyunsook Kim3, Kun-Ho Seo1,
Author Information & Copyright
1Center for One Health, College of Veterinary Medicine, Konkuk University, Seoul, Korea
2National Center for Toxicological Research, US Food and Drug Administration, Jefferson, USA
3Dept. of Food & Nutrition, College of Human Ecology, Hanyang University, Seoul, Korea
*Corresponding Author : Kwang-Young Song, Center for One Health, College of Veterinary Medicine, Konkuk University, Seoul Korea. Tel : +82-2-450-4121,Fax : +82-2-3436-4128, E-mail : drysong@gamil.com
† These authors contributed equally to this study.

ⓒ Copyright 2017, Korean Society of Milk Science and Biotechnology. This is an Open-Access article distributed under the terms of the Creative Commons Attribution Non-Commercial License (http://creativecommons.org/licenses/by-nc/3.0/) which permits unrestricted non-commercial use, distribution, and reproduction in any medium, provided the original work is properly cited.

Received: Jun 05, 2017 ; Revised: Jun 19, 2017 ; Accepted: Jun 25, 2017

Published Online: Jun 30, 2017

Abstract

The global consumption of fructose in the form of high-fructose corn syrup (HFCS) has increased considerably over the past several decades. The current intake of HFCS exceeds that of other major caloric sweeteners such as sucrose. Fructose has potentially adverse effects on human metabolism. Therefore, the objective of this study was to analyze the monosaccharide contents of 13 sweetened milk-based beverages by using high-performance liquid chromatography (HPLC). The total monosaccharide (fructose and glucose) contents of various sweetened milk-based beverages ranged from 0.60 g/100 mL (cheese) to 26.03 g/100 mL (maple caramel snack), while milk showed only 0 g/100 mL monosaccharides. The fructose-to-glucose ratio of various popular sweetened milk-based beverages ranged from not-detected (ND) to 2.24 g/100 mL, but the content of glucose was higher than that of fructose in only three samples, namely, strawberry flavored milk, shrimp chips, and maple caramel snack. The analyzed results revealed important basic information about monosaccharides in various milk-based sweetened beverages, presenting ideas for future fructose research.


Introduction

Until the 1970s, cane sugar had been people’s most delightful sweetener of choice (Goran et al., 2013). However, when the much less expensive corn-derived sweeteners like maltodextrin and high-fructose corn syrup (HFCS) were developed, HFCS intake has increased rapidly (Forshee et al., 2007). According to the Corn Refiners Association, HFCS is “either 42 percent or 55 percent fructose” combined with the remaining percentage of glucose, although HFCS with higher fructose content could be produced (Hanover and White, 1993; White, 2008). In general, regular table sugar (sucrose) is 50% fructose and 50% glucose, but HFCS could contain up to 80% (or 42~55%) fructose and 20% (or 45~58%) glucose, almost twice the fructose of common table sugar (Babacanoglu et al., 2013).

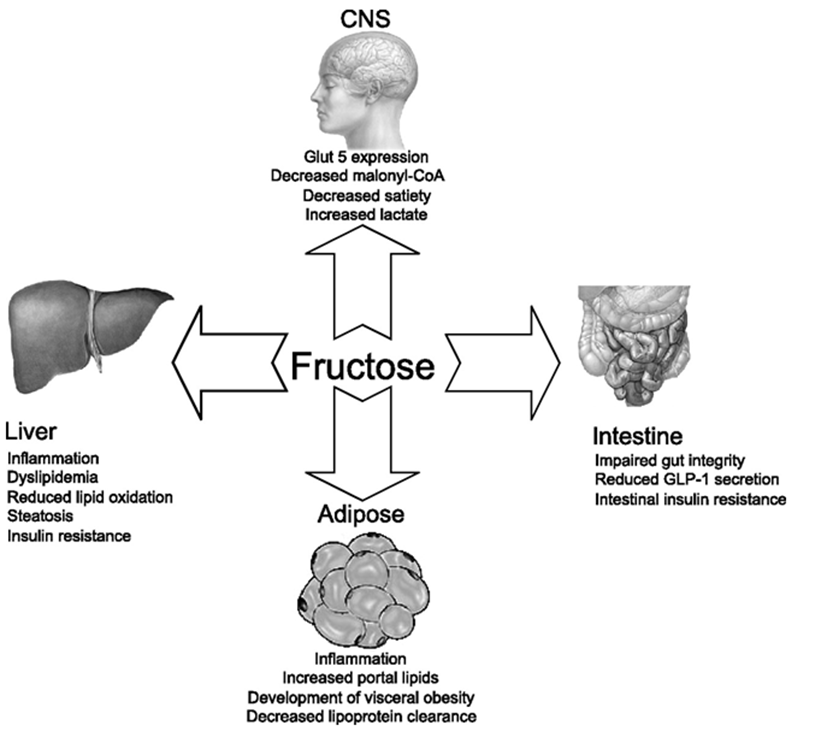
In USA, the consumption of total fructose increased by nearly 30% between 1970 and 2000, largely due to the increased use of HFCS (Bray et al., 2004). Also many people are being poisoned by a common additive present in a wide array of processed foods like breakfast cereals, breads, cakes, cookies, soft drinks, salad dressings, and so on (Ventra et al., 2010). This additive increases the risk of atherosclerosis, diabetes, fatty liver disease, hypertension, obesity, etc., and this toxic additive is HFCS (Parrish, 2010; Latulippe and Skoog, 2011) (Fig. 1).
jmsb-35-2-99-g1
Fig. 1. The relationship between consumption of HFCS and numerous adverse medical conditions.(Resource: Parrish, 2010; Latulippe and Skoog, 2011)
Download Original Figure

Furthermore, in recent years, the metabolism due to excessive intake of fructose is the major concern (Akar et al., 2012). The alarming rise in diseases has been mirrored by an equally dramatic increase in fructose consumption, particularly in the form of the corn-derived sweetener, HFCS (Iida et al., 2013) .

Hence, the objective of this study was to conduct to analyze the contents of fructose and glucose on various popular sweetened beverages based on milk using HPLC method.

Material and Methods

1. Samples preparation of various sweetened beverages based on milk

Thirteen samples of various popular sweetened beverages based on milk were purchased in Seoul, South Korea from August 2016 to January 2017 (Table 1). All of the samples was domestically produced in South Korea. Samples were purchased and shipped to the laboratory. For sample analysis, sample preparations were conducted following Zeppa et al. (2001) with some modifications.

Table 1. Comparison of sugar contents from various popular sweetened beverages based on milk
Dairy Products Sugar content by HPLC
Lactose
(g/100 mL, %)
Fructose
(g/100 mL, %)
Glucose
(g/100 mL, %)
Galactose
(g/100 mL, %)
Total monosaccharide
(g/100 mL, %)
Fructose :
Glucose ratio
Milk 4.34±0.12 ND* ND ND ND ND
Choco flavored milk 3.54±0.39 4.33±0.36 3.93±0.15 ND 8.26±0.51 1.10 : 1
Strawberry flavored milk 4.29±0.32 1.22±0.10 1.25±0.12 ND 2.48±0.22 1 : 1.02
Commercial yogurt 1 1.80±0.22 ND ND 0.86±0.12 0.86±0.12 ND
Commercial yogurt 2 2.95±1.04 1.06±0.08 1.04±0.07 0.23±0.02 2.34±0.17 1.02 : 1
Commercial yogurt 3 2.98±0.82 ND ND 0.51±0.05 0.51±0.05 ND
Apple juice ND 7.16±1.06 3.19±0.32 ND 10.35±1.38 2.24 : 1
Orange juice ND 4.59 ±0.04 3.72±0.68 ND 8.30±0.72 1.23 : 1
Mango juice ND 5.21±0.10 4.70±0.27 ND 9.91±0.37 1.10 : 1
Natural cheese 3.73±0.62 ND ND 0.08±0.01 0.08±0.01 ND
Cheese 0.07±0.02 0.60±0.01 ND ND 0.60±0.01 ND (Only fructose)
Shrimp chips 1.11±0.04 3.10±0.06 3.35±0.48 ND 6.44±0.54 1 : 1.08
Maple caramel snack 3.18±0.24 12.96±1.62 13.07±1.12 ND 26.03±2.74 1 : 1.01

*ND: Not detected.

Results were obtained by high performance liquid chromatography (HPLC).

Download Excel Table
2. Reagents and materials

Reference standards of glucose, galactose, fructose, lactose (purity ≥ 99.0%) were purchased from Sigma–Aldrich (St. Louis, MO, USA). Deionized water was purified by a Milli-Q system (Milipore Corp., Bedford, MA, USA) and1N sulfuric acid was from Fischer Scientific (Piscataway, NJ, USA) and diluted with deionized water for use. All solvents were HPLC-grade and were used without further purification. A set of standard solutions and quality control (QC) solutions for varous sugars were prepared by successive dilution of the stock solutions (1 mg/mL for each standard samples) with purified deionized water. All solutions were stored at −80℃ until used in analyses.

3. High-performance liquid chromatography (HPLC) analysis of fructose fractions

Sample analysis was performed using Agilent 1260 HPLC ChemStationTM (Agilent,Palo Alto, USA) equipped with UV Detector and RI detector (Table 2). The separation of each sample was performed on a Hi-Plex Ca column (6.5 mm×300 mm) using an automatic injector (G1367E, 1260 Hip-ALS, Agilent Technologies 1290 Infinity) and Guard Column (4.6 mm ID × 12.5 mm, Agilent, USA). Mobile phase was deionized H2O at a flow rate of 0.6 mL min−1. The column and auto-sampler tray were maintained at 80℃ and 4℃, respectively. The analytical run time was 30 min.

Table 2. The instrumental conditions for sugar extraction analysis by HPLC
Items Conditions
Instrument Agilent 1200 HPLC ChemStationTM(Agilent, USA)
Column Guard Column(4.6 mm ID × 12.5 mm, Agilent, USA)Hi-Plex Ca Carbohydrate Analysis column(6.5 mm×300 mm)
Detector 210 and 290 nm UV Detector (325 Dual Wavelength UV-Vis Detector, Agilent, USA)Refractive Index Detector(RID, Agilent, USA)
Mobile phase A: H2O
Flow rate 0.6 mL/min
Column temp. 80℃
Injection volume 10 uL
Download Excel Table
4. Statistical analysis

For assessing the reliability of this study, all data obtained this study were statistically analyzed and also were recalculated total sugar content in grams per 100 mL by summing the fructose, glucose, and sucrose results using the coefficient of variation for the standard solutions. The concentration of lactose, glucose and galactose were computed for Least-Squares means using SPSS GLM procedures, and mean concentrations were tested for significance (p<0.05) using Duncans multiple range test. The experiment was duplicated.

Results and Discussion

1. Total monosaccharide content of various popular sweetened beverages based on milk

As shown in Table 1, the total monosaccharide (fructose+ glucose) content of various popular sweetened beverages based on milk ranged from 0.60 g/100 mL (cheese) to 26.03 g/100 mL (maple caramel snack), but only milk showed 0 g/100 mL. Choco flavored milk and strawberry flavored milk showed 8.26 g/100 mL and 2.46 g/100 mL, respectively. Three different commercial yogurts contained from 0.51 g/100 mL, 0.86 g/100 mL, 2.34 g/100 mL, respectively. In Juice, the content of Orange was 8.30 g/100 mL, Mango was 9.91 g/100 mL, and Apple was 10.35 g/100 mL. Shrimp chips showed 6.44 g/100 mL. but there was no difference between Natural cheese (0.08 g/100 mL) and Cheese (0.60 g/100 mL). According to previous research, Ventra et al.(2011) reported that the total sugar content of the beverages ranged from 5.5 g/100 mL to 12.7 g/100 mL. The results of this study showed that the content of sugar of various popular sweetened beverages based on milk varied differently depending on the food categories but showed the similar pattern (Table 1).

2. Fructose-to-glucose ratio of various popular sweetened beverages based on milk

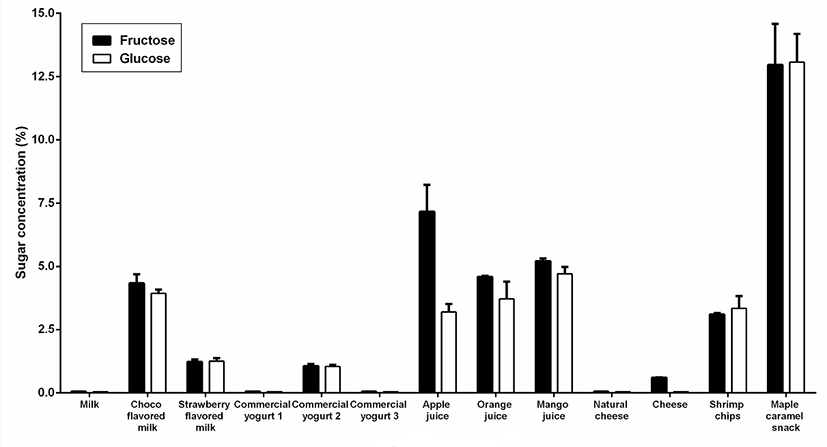
As shown in Fig. 2, the fructose-to-glucose ratio of various popular sweetened beverages based on milk showed from ND (Not detected) to 2.24. But the content of glucose contained higher than that of fructose in only 3 samples- Strawberry flavored milk, Shrimp chips, and Maple caramel snack (Table 1).
jmsb-35-2-99-g2
Fig. 2. The fructose-to-glucose ratio of various popular sweetened beverages based on milk as assessed by HPLC method.
Download Original Figure

To compare with previous study, the fructose-to-glucose ratio of Coca-Cola varied from 58:42 to 65:35 for the three sample of USA, but that of Mexican Coca-Cola sample showed 52:48. Also, the fructose-to-glucose ratio of the three samples of Sprite ranged from 59:41 to 64:36 and the three samples of Pepsi ranged from 58:42 to 65:35 (Ventra et al., 2011).

The results of this study showed that various popular sweetened beverages based on milk contained higher fructose than glucose and showed the similar pattern (Fig. 2 and Table 1).

In general, sucrose (table sugar) as disaccharide was composed of fructose and glucose. Despite its very similar chemical structure, fructose and glucose were absorbed and metabolized by completely different pathways. In contrast to glucose, fructose was absorbed through the GLUT-5 receptor in the gut and was metabolized mostly in the liver by a pathway which was not dependent on insulin (Douard and Ferraris, 2008; Gaby, 2005). Hence, fructose consumption did not stimulate insulin secretion or leptin production by adipose tissue and could contribute directly to weight gain (Teff et al., 2009; Stanhope and Havel, 2008). Furthermore, excess consumption of fructose was related to the specific accumulation of visceral fat and associated metabolic risk factors as insulin resistance than excess consumption of glucose (Stanhope et al., 2009).

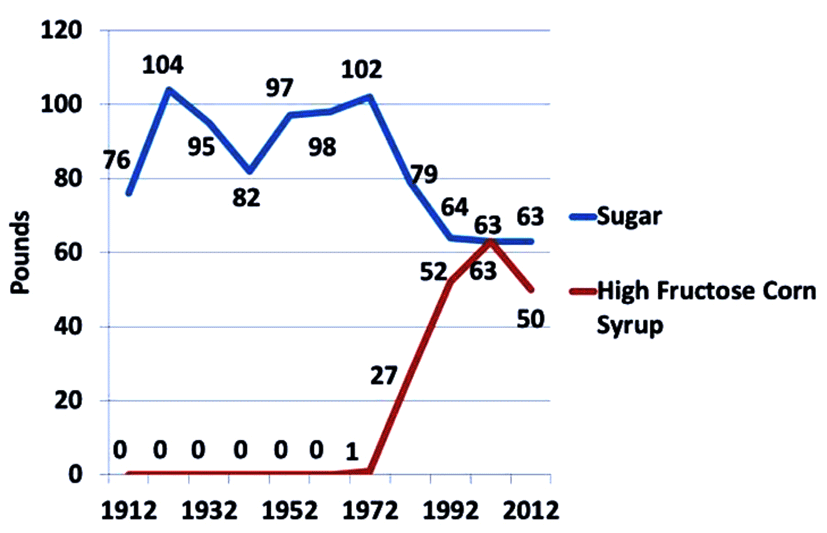
Furthermore, the yearly consumption of HFCS increased by over 1,000%, greatly exceeding the change in consumption of any other food or food group between 1970 and 1990 (Fig. 3). Hence, HFCS is now the main caloric sweetener added to soft drinks in the world, and comprises more than 40% of caloric sweeteners added to foods and beverages. table-wra
jmsb-35-2-99-g3
Fig. 3. The trend of sugar and HFCS per capita availability from 1912 to 2012 in USA.(Resource: Walker et al., 2014)
Download Original Figure

Using HPLC analysis, this study showed similar significant findings (Ventura et al., 2011). At first, the total carbohydrate content of various popular sweetened beverages based on milk varies from the food label provided by the food company. At second, the fructose-to-glucose ratio in various popular sweetened beverages based on milk showed difference according to food categories. At last, the type of sugar detected by the HPLC analysis was not always consistent with the type of sugar (lactose, fructose, glucose, galactose) listed on the food label.

Until now, HFCS grimly and quietly entered the food supply decades ago (Kimber and Stanhope, 2016). Recently, HFCS is omnipresent in a wide variety of foods. HFCS has been related to an increased risk of a broad range of metabolic diseases and conditions (Rippe and Angelopoulos, 2016). Namely, excessive intake of dietary fructose from sources such as HFCS could contribute to myriad adverse health effects ranging from metabolic syndrome to kidney stones to the complications of diabetes (Yu et al., 2013). Therefore, the best way to reduce the intake of HFCS is to read the food label of food products before purchasing them, and also avoiding foods which contain HFCS and another added sugars such as sucrose (Campos and Tappy, 2016). Therefore, the results of this study could show the basic important information to estimating fructose consumption and also the relationship between fructose consumption and metabolic health. Then, the further studies are needed to assess current outcome.

Disclaimer

The views expressed herein do not necessarily reflect those of the US Food and Drug Administration or the US Department of Health and Human Services.

References

1.

Akar, F., Uludag, O., Aydin, A., Aytekin, Y. A., Elbeg, S., Tuzcu, M. and Sahin, K. 2012. High-fructose corn syrup causes vascular dysfunction associated with metabolic disturbance in rats: Protective effect of resveratrol. Food and Chemical Toxicology 50:2135-2141.

2.

Babacanoglu, C., Yildirim, N., Sadi, G., Pektas, M. B. and Akar, F. 2013. Resveratrol prevents high-fructose corn syrup-induced vascular insulin resistance and dysfunction in rats. Food and Chemical Toxicology 60:160-167.

3.

Bocarsly, M. E., Powell, E. S., Avena, N. M. and Hoebel, B. G. 2010. High-fructose corn syrup causes characteristics of obesity in rats: Increased body weight, body fat and triglyceride levels. Pharmacology Biochemistry and Behavior 97:101-106.

4.

Bray, G. A., Nielsen, S. J. and Popkin, B. M. 2004. Consumption of high-fructose corn syrup in beverages may play a role in the epidemic of obesity. Am. J. Clin. Nutr. 79:537-543.

5.

Campos, V. C. and Tappy, L. 2016. Physiological handling of dietary fructose-containing sugars: implications for health. Int. J. Obes. (Lond). 40 Suppl1:S6-S11.

6.

Douard, V. and Ferraris, R. P. 2008. Regulation of the fructose transporter GLUT5 in health and disease. Am. J. Physiol. Endocrinol. Metab. 295:E227-E237.

7.

Forshee, R. A., Storey, M. L., Allison, D. B., Glinsmann, W. H., Hein, G. L., Lineback, D. R., Miller, S. A., Nicklas, T. A., Weaver, G. A. and White, J. S. 2007. A critical examination of the evidence relating high fructose corn syrup and weight gain. Critical Reviews in Food Science and Nutrition 47:561-582.

8.

Gaby, A. R. 2005. Adverse effects of dietary fructose. Altern. Med. Rev. 10:294-306.

9.

Goran, M. I., Ulijaszek, S. J. and Ventura, E. E. 2013. High fructose corn syrup and diabetes prevalence: A global perspective. Global Public Health 8:55-64.

10.

Hanover, L. M. and White, J. S. 1993. Manufacturing, composition, and applications of fructose. Am. J. Clin. Nutr. 58:724S-732S.

11.

Iida, T., Yamada, T., Hayashi, N., Okuma, K., Izumori, K., Ishii, R. and Matsuo, T. 2013. Reduction of abdominal fat accumulation in rats by 8-week ingestion of a newly developed sweetener made from high fructose corn syrup. Food Chemistry 138:781-785.

12.

Kimber, L. and Stanhope, K. L. 2016. Sugar consumption, metabolic disease and obesity: The state of the controversy. Critical Reviews in Clinical Laboratory Sciences 53:52-67.

13.

Latulippe, M. E. and Skoog, S. M. 2011. Fructose malabsorption and intolerance: Effects of fructose with and without simultaneous glucose ingestion. Critical Reviews in Food Science and Nutrition 51:583-592.

14.

Parrish L. A. 2010. How does the consumption of fructose and high fructose corn syrup impact the health of children and adolescents? J. Pediatr. Nurs. 25:459-460.

15.

Rippe, J. M. and Angelopoulos, T. J. 2016. Added sugars and risk factors for obesity, diabetes and heart disease. Int J Obes (Lond). 40 Suppl1:S22-S27.

16.

Stanhope, K. L. and Havel, P. J. 2008. Endocrine and metabolic effects of consuming beverages sweetened with fructose, glucose, sucrose, or high-fructose corn syrup. Am. J. Clin. Nutr. 88:1733S-1737S.

17.

Stanhope, K. L., Schwarz, J. M., Keim, N. L., Griffen, S. C., Bremer, A. A., Graham, J. L., Hatcher, B., Cox, C. L., Dyachenko, A., Zhang, W., McGahan, J. P., Seibert, A., Krauss, R. M., Chiu, S., Schaefer, E. J., Ai, M., Otokozawa, S., Nakajima, K., Nakano, T., Beysen, C., Hellerstein, M. K., Berglund, L. and Havel, P. J. 2009. Consuming fructose-sweetened, not glucose- sweetened, beverages increases visceral adiposity and lipids and decreases insulin sensitivity in overweight/ obese humans. J. Clin. Invest. 119:1322-1334.

18.

Teff, K. L., Grudziak, J., Townsend, R. R., Dunn, T. N., Grant, R. W., Adams, S. H., Keim, N. L., Cummings, B. P., Stanhope, K. L. and Havel, P. J. 2009. Endocrine and metabolic effects of consuming fructose- and glucose-sweetened beverages with meals in obese men and women: influence of insulin resistance on plasma triglyceride responses. J. Clin. Endocrinol. Metab. 94:1562-1569.

19.

Ventura, E. E., Davis, J. N. and Goran, M. I. 2011. Sugar content of popular sweetened beverages based on objective laboratory analysis: Focus on fructose content. Obesity 19:868-874.

20.

Walker, R. W., Dumke, K. A. and Goran, M. I. 2014. Fructose content in popular beverages made with and without high-fructose corn syrup. Nutrition 30:928- 935.

21.

White, J. S. 2008. Straight talk about high-fructose corn syrup: what it is and what it ain't. Am. J. Clin. Nutr. 88:1716S-1721S.

22.

Yu, Z., Lowndes, J. and Rippe, J. 2013. High-fructose corn syrup and sucrose have equivalent effects on energy-regulating hormones at normal human consumption levels. Nutrition Research 33:1043-1052.

23.

Zeppa, G., Conterno, L. and Gerbi, V. 2001. Determination of organic acids, sugars, diacetyl, and acetoin in cheese by high-performance liquid chromatography. J. Agric. Food Chem. 49:2722-2726.